
Telemetry Demo: Arduino + Processing + Python
It was a bit like a high-stakes science fair project. In the early days of the MCC we were often trying to communicate or sell our vision of what it could become. We needed the volunteers to be as excited about the project as we were and carry that up through the chain of command and attract enough interest so they would help fund the project. This meant that we had to use a lot of our own gear to build a working network in the vehicle so they could get a tangible feel for the possibilities. It also meant that we had to get creative with some of more advanced features of the plan, like voice-over-IP, cellular data, and for this small sub-project, system telemetry for the vehicle.
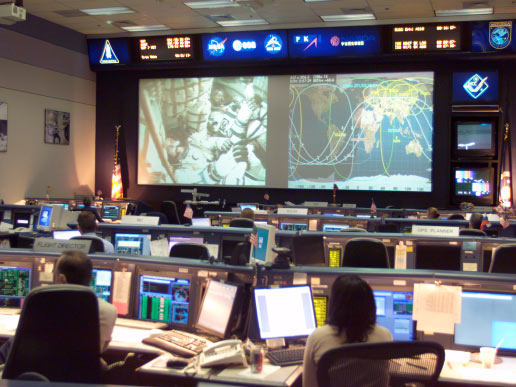
NASA Mission Control: Our inspirational model.
We often go back to NASA Mission Control as a source of inspiration. So part of the design has included remote monitoring and control of the MCC while it's in the field. One of the primary missions of the deployed communications team is to gather and route information back to headquarters. Gathering more information and delivering it automatically back to the Disaster Communications Center or to the Disaster Operations Center makes a lot of sense. If a manager can quickly see from a website where the vehicle is, what the weather is like, what the cameras see, they don't have to bother the communications team with a status request. In our planning meetings we talk about the future scenario where a manager just opens up their laptop at home and they can VPN into the truck, get eyes on the situation and have a quick phone call with communications team using a soft phone. But before we can get there, we have to sell that vision to the people who run the business. Enter, the demonstration.
Demo Overview
So in addition to building our own 802.11 network, a VoIP solution and borrowing a cellular data service, we also wanted to demonstrate the telemetry features. I buit a simple piece of hardware that had a couple of on/off switches to simluate the status of major systems like air-conditioning, and the generator, a potentiometer was used to simulate the fuel gauge, and digital compass was used to indicate where the video camera was pointing. GPS was simulated in software.
All of these physical inputs were connected to an arduino, which reported the input values at a regular interval via USB serial connection to a host system The host server monitored input from the serial port and updated a status file on the webserver, and maintained a history of values. A java applet created with Processing (http://processing.org) queried the status file and displayed a simple mission control style status screen. Red/Green lights indicated the status of the air-conditioner and the generator, while a fuel gauge showed fuel status, and would flash an alert if the value was too low. A small simulated Google map application showed where the truck was, while a visibility cone was plotted on top of it to show the potential field-of-view from the camera.

A lot of moving parts: flow diagram of the telemetry demo.
The telemetry demonstration hardware eventually looked like this during showtime:
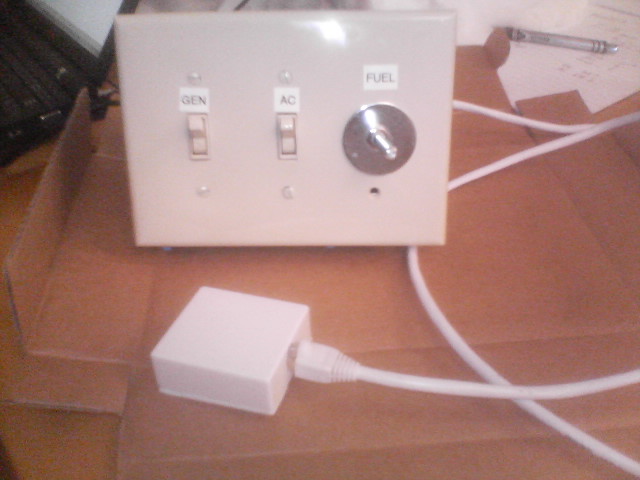
Moments before showtime: New code features were pushed to the Arduino shortly before the first attendees arrived.
What is looked like
There were two main goals that we were shooting for on that day. We wanted something interactive to show normal people how physical measurements could be quickly recorded and presented to the screen, and under-the-hood we wanted to work through kinks of getting the physical world measurable over simple protocols like HTTP.
The server connected to the Arduino over USB and simply polled the status of each of the sensors and recorded these in a temporary file. The server then responded to HTTP requests an presented the data depending on how the request was made. For example a request to /raw would just dump out the latest status:
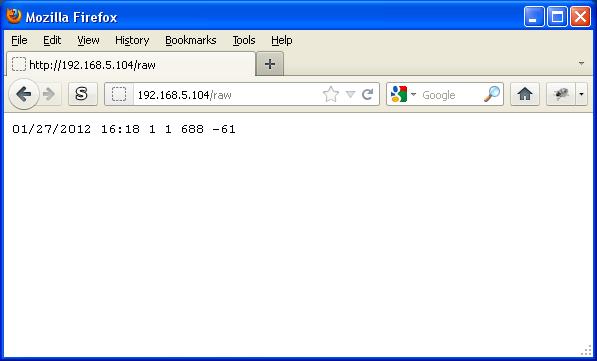
Although it's very simple, it's also very powerful. The physical status of the system is now pollable from anywhere on the planet. With a simple data-format like that, the user can use the bits that they need and throw the others away, or track it over time to trend it, set alert condition, or simply visualize it in a pleasing manner. When I do this again, I'll likely upgrade it to return XML to make it easier to understand by labeling what the data columns are.
On the server we implemented a very simple display when a /status request was sent:

This is as simple as an HTML display can get, it's even compatible with text-based browsers. To get fancy, you can click to get a fuel history graph like this:

While this may have been cutting edge in the 90s this wasn't going to make much of an impression to the dignitaries that were going to tour the vehicle. This is when I reached to Processing to make a more dynamic visualization for the telemetry data. Below is a snapshot of tool in action before I started to dismantle it.
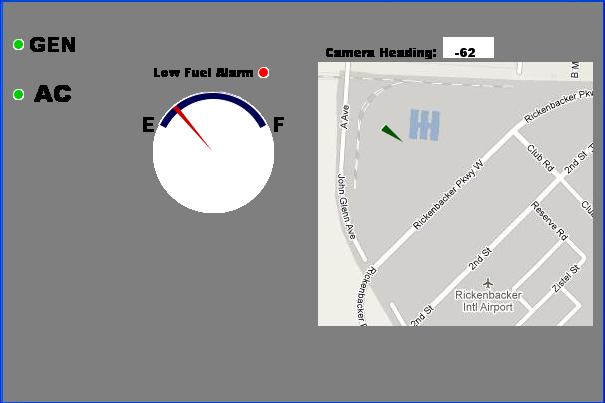
The green lights indicate that the air conditioner and the generator are running. The fuel gauge shows the current fuel level and the low-fuel indicator is lit. To the right is a google map of where the MCC was for the drill (I cheated since GPS data wasn't available) and the green triangle approximates the viewing angle of the camera.
Letting them play with the switches and see things change on the screen didn't have the impact that I wanted, but the compass feature seemed to be a thing of magic to them.
Where to start? How about the inputs.
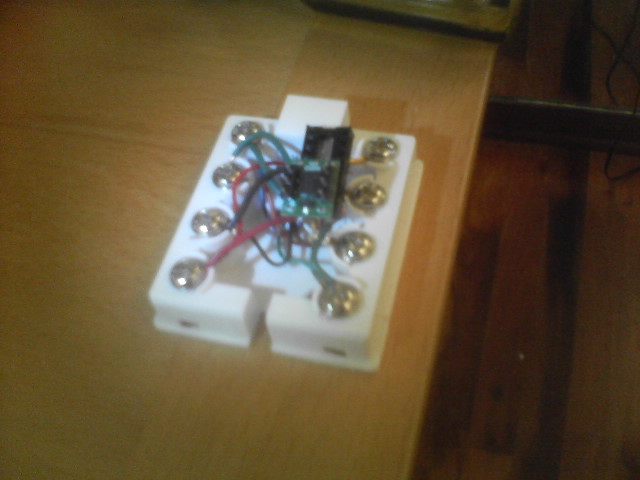
Sometimes it's difficult to know where to start when describing something, in this case I arbitrarily choose to start with the inputs and work my way down the diagram. The digital compass is a Hitachi HM55B Compass Module that I got from Parallax (http://www.parallax.com). Although the documentation is for a BASIC Stamp, it's pretty easy to convert that code over to Arduino which we'll see below. Michael came up with the idea of mounting the module inside of a telco biscuit, aka surface mount jack. This gives one a tiny project box with an RJ-45 jack and widely spaced break out access to the individual pins of the jack. The general theory is, you use two of these, one on the main project box, and one that contains the compass module, and then just run a long network cable between the two. Here we see the inside of the biscuit with the module wired in.
Construction Tip:
You don't need specialized electronics project boxes to house your own projects. Take a look at what containers you already have on-hand or take a walk through your neighborhood hardware store looking at things in a different light
By re-purposing a surface mount jack as a sensor housing, or using an electrical gang box to house the project we were able to fabricate the demo quickly and cheaply.
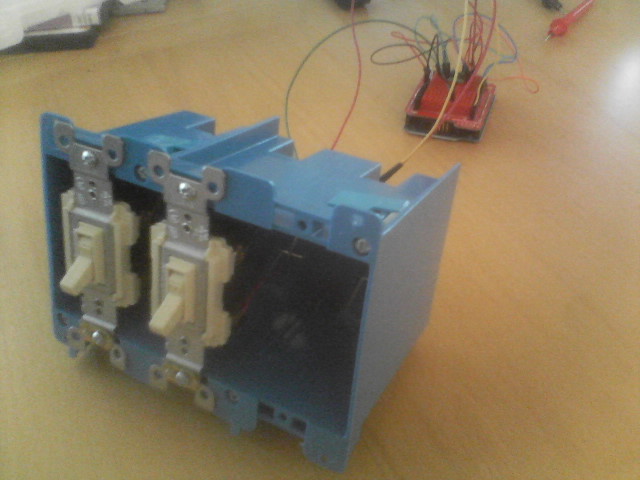
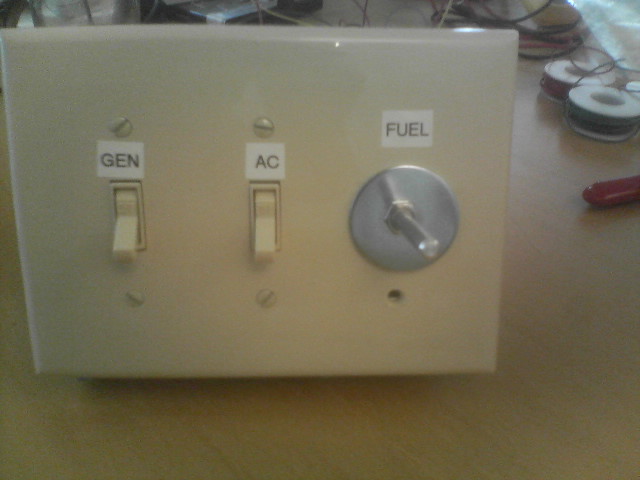
Continuing on with the easy-to-find project boxes we used a 3 gang electrical box to house the main project. Normal light-switches are used as our digital inputs to the generator and air-conditioning monitor. I found a large form-factor potentiometer at a nearby radio-shack and used a large washer to mount it to the standard three-switch face-plate. Finally the Arduino module was placed inside and a network cable and a USB cable snaked out through the hole in the back of the electrical box.
The Arduino Bits
Next up in the flow diagram is the Arduino module. Microcontrollers are best described by their inputs and outputs. This one was configured to accept two digital inputs (one for the generator status, one for the air-conditioner status,) one analog input for the fuel gauge, and it held a conversation with the Compass module over a private bus and another with the host server via USB. I built the system up starting with the easiest bits then adding complexity.
Digital Inputs
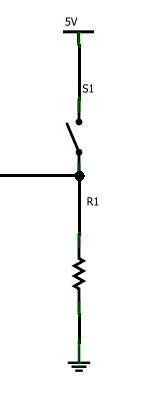
One of the simplest inputs for a microcontroller is a digital input from a basic switch. Shown here is a setup that will set the pin status to HIGH when the switch is on, and the pull-down resistor will set it to LOW when the switch is off. A bit of pseudo-code to check the status of the pin is below.
// stwitch status monitor with debunce
//Logic, On is HIGH
//

const int genSwitchPin = 3;
const int acSwitchPin = 2;

int genState;
int acState;

int lastGenState = LOW;
int lastAcState = LOW;

long lastGenDebounceTime = 0;
long lastAcDebounceTime = 0;
long debounceDelay = 50;

void setup() {
  Serial.begin(115200);
  pinMode(genSwitchPin, INPUT);
  pinMode(acSwitchPin, INPUT);
}

void loop() {
  int genReading = digitalRead(genSwitchPin);
  if (genReading != lastGenState) {
    lastGenDebounceTime = millis();
  }
  if ((millis() - lastGenDebounceTime) > debounceDelay) {
    genState = genReading;
  }

  int acReading = digitalRead(acSwitchPin);
  if (genReading != lastAcState) {
    lastAcDebounceTime = millis();
  }
  if ((millis() - lastAcDebounceTime) > debounceDelay) {
    acState = acReading;
  }

  // print out the readings
  Serial.print("Gen: ");
  Serial.print(genState);
  Serial.print("  AC: ");
  Serial.print(acState);
  Serial.println("");

  // set current state beforelooping
  lastGenState = genReading;
  lastAcState = acReading;
}
What the code does
First we define a few variables and set a few human-friendly constants, noting that pin 2 is the generator status and pin 3 is the air-conditioner. Then we define the setup routine to set the baud rate of the system (we're using USB in this case) to 115200 and instructing the Arduino to set pins 2 and 3 to be INPUT pins. Then we define our loop. Where we get the status of the ping with the digitalRead routine. If we wanted we could simply leave it at that, but to get a more accurate reading of the pin status we need to de-bounce the signal. When you physically flip a switch, the connection will physically bounce, so the electrical signal won't be a nice clean digital switch from 0 to 1, but a series of transitions between 0 and 1 until the switch settles into place. This is why we have this extra bit of complexity here making sure that each transition from 0 to 1 and back are clean.
After pulling the pin state and debouncing them, the loop prints out the current switch statuses over the serial port. While running the terminal window in the Arduino IDE will be spammed with "Gen: 0 AC: 1" messages. Not elegant, but it's simple and not that far from your first "Hello World" Arduino program.
Basic Arduino Code Structure
Perhaps I should take a moment to describe basic Arduino/Processing code structure. Every program has at least two subroutines. If it's a microcontroller or a simple java applet when it starts up (either once the arduino boots, or the applet is downloaded and executed on a browser) the setup() routine is executed. Then the loop() routine is called and loops forever.
Analog Input
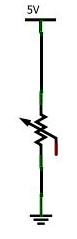
Here we have the basic analog input where a potentiometer wiper is connected to an analog input pin on the Arduino. The code to pull the reading is much simpler, just define the pin (0 in our project) and call analogRead().
// stwitch status monitor with debunce
//
//Logic, On is HIGH
//
//adding analog input to read the fuel gague
//


const int genSwitchPin = 3;  // Generator switch
const int acSwitchPin = 2;  // Air Conditioner
const int fuelPin = 0; // fuel potentiometer

int genState;
int acState;

int lastGenState = LOW;
int lastAcState = LOW;
int fuelValue = 0; // raw fuel value, percentage to be calculated later

long lastGenDebounceTime = 0;
long lastAcDebounceTime = 0;
long debounceDelay = 50;

void setup() {
  Serial.begin(115200);
  pinMode(genSwitchPin, INPUT);
  pinMode(acSwitchPin, INPUT);
}

void loop() {
  // read Generator switch
  int genReading = digitalRead(genSwitchPin);
  if (genReading != lastGenState) {
    lastGenDebounceTime = millis();
  }
  if ((millis() - lastGenDebounceTime) > debounceDelay) {
    genState = genReading;
  }

  // read Air Conditioner switch
  int acReading = digitalRead(acSwitchPin);
  if (genReading != lastAcState) {
    lastAcDebounceTime = millis();
  }
  if ((millis() - lastAcDebounceTime) > debounceDelay) {
    acState = acReading;
  }

  // read raw fuel sensor value
  fuelValue = analogRead(fuelPin);

  // print out the readings
  Serial.print("Gen: ");
  Serial.print(genState);
  Serial.print("  AC: ");
  Serial.print(acState);
  Serial.print("  Fuel: ");
  Serial.print(fuelValue);
  Serial.println("");

  // set current state beforelooping
  lastGenState = genReading;
  lastAcState = acReading;
}
Like I said, not a lot of difference between these bits of code, it's still mostly testing code, sending output to the Arduino IDE terminal. The full schematic at this point isn't too complex either.

Asking for Directions
I connect the Arduino to the compass module using the 3-wire interface described in the product sheet. I also copy/pasted some demo code into my current program, and modify it slightly, mainly making changes to what pin performs what function.
The schematic with just the compass (to make it more readable):

The code now looks like:
// stwitch status monitor with debunce // //Logic, On is HIGH // //analog input to read the fuel gague // //adding compass code from kiilo: http://www.arduino.cc/playground/Main/HM55B // ///////////////////////////////// //Htachi HM55B Compass //parallax (#) // //AUTHOR: kiilo kiilo@kiilo.org //License: http://creativecommons.org/licenses/by-nc-sa/2.5/ch/ // //http://parallax.com/Store/Microcontrollers/BASICStampModules/tabid/134/t... //http://sage.medienkunst.ch/tiki-index.php?page=HowTo_Arduino_Parallax_HM... //http://arduino.cc/playground/HM55B // ///////////////////////////////// #include// (no semicolon) //// VARS byte CLK_pin = 8; byte EN_pin = 9; byte DIO_pin = 10; int X_Data = 0; int Y_Data = 0; int angle; const int genSwitchPin = 3; /* Generator switch */ const int acSwitchPin = 2; /* Air Conditioner */ const int fuelPin = 0; /*fuel potentiometer */ int genState; int acState; int lastGenState = LOW; int lastAcState = LOW; int fuelValue = 0; // raw fuel value, percentage to be calculated later long lastGenDebounceTime = 0; long lastAcDebounceTime = 0; long debounceDelay = 50; //// FUNCTIONS void ShiftOut(int Value, int BitsCount) { for(int i = BitsCount; i >= 0; i--) { digitalWrite(CLK_pin, LOW); if ((Value & 1 << i) == ( 1 << i)) { digitalWrite(DIO_pin, HIGH); //Serial.print("1"); } else { digitalWrite(DIO_pin, LOW); //Serial.print("0"); } digitalWrite(CLK_pin, HIGH); delayMicroseconds(1); } //Serial.print(" "); } int ShiftIn(int BitsCount) { int ShiftIn_result; ShiftIn_result = 0; pinMode(DIO_pin, INPUT); for(int i = BitsCount; i >= 0; i--) { digitalWrite(CLK_pin, HIGH); delayMicroseconds(1); if (digitalRead(DIO_pin) == HIGH) { ShiftIn_result = (ShiftIn_result << 1) + 1; //Serial.print("x"); } else { ShiftIn_result = (ShiftIn_result << 1) + 0; //Serial.print("_"); } digitalWrite(CLK_pin, LOW); delayMicroseconds(1); } //Serial.print(":"); // below is difficult to understand: // if bit 11 is Set the value is negative // the representation of negative values you // have to add B11111000 in the upper Byte of // the integer. // see: http://en.wikipedia.org/wiki/Two%27s_complement if ((ShiftIn_result & 1 << 11) == 1 << 11) { ShiftIn_result = (B11111000 << 8) | ShiftIn_result; } return ShiftIn_result; } void HM55B_Reset() { pinMode(DIO_pin, OUTPUT); digitalWrite(EN_pin, LOW); ShiftOut(B0000, 3); digitalWrite(EN_pin, HIGH); } void HM55B_StartMeasurementCommand() { pinMode(DIO_pin, OUTPUT); digitalWrite(EN_pin, LOW); ShiftOut(B1000, 3); digitalWrite(EN_pin, HIGH); } int HM55B_ReadCommand() { int result = 0; pinMode(DIO_pin, OUTPUT); digitalWrite(EN_pin, LOW); ShiftOut(B1100, 3); result = ShiftIn(3); return result; } void setup() { Serial.begin(115200); pinMode(genSwitchPin, INPUT); pinMode(acSwitchPin, INPUT); pinMode(EN_pin, OUTPUT); pinMode(CLK_pin, OUTPUT); pinMode(DIO_pin, INPUT); HM55B_Reset(); } void loop() { // read Generator switch int genReading = digitalRead(genSwitchPin); if (genReading != lastGenState) { lastGenDebounceTime = millis(); } if ((millis() - lastGenDebounceTime) > debounceDelay) { genState = genReading; } // read Air Conditioner switch int acReading = digitalRead(acSwitchPin); if (genReading != lastAcState) { lastAcDebounceTime = millis(); } if ((millis() - lastAcDebounceTime) > debounceDelay) { acState = acReading; } // read raw fuel sensor value fuelValue = analogRead(fuelPin); // read compass sensor HM55B_StartMeasurementCommand(); // necessary!! delay(40); // the data is 40ms later ready HM55B_ReadCommand(); X_Data = ShiftIn(11); // Field strength in X Y_Data = ShiftIn(11); // and Y direction digitalWrite(EN_pin, HIGH); // ok deselect chip angle = 180 * (atan2(-1 * Y_Data , X_Data) / M_PI); // angle is atan( -y/x) !!! // print out the readings Serial.print("Gen: "); Serial.print(genState); Serial.print(" AC: "); Serial.print(acState); Serial.print(" Fuel: "); Serial.print(fuelValue); Serial.print(" Heading: "); Serial.print(angle); Serial.println(""); // set current state beforelooping lastGenState = genReading; lastAcState = acReading; }
Now we still have a loop that spams the terminal with the system status, how do we clean that up to have it talk to a computer?
Delivering a Packet
In our Arduino/Server communication, we're going to make a really simple (and fragile) protocol. The server will expect a series of digits, separated by spaces and ended with an End-of-line. It's really not much to speak of, other than, this isn't something you'd want to do in a real solution. To accomplish this amazing marvel I modify the last code thusly:
// print out the readings
  //Serial.print("Gen: ");
  Serial.print(genState);
  Serial.print(" ");
  //Serial.print("  AC: ");
  Serial.print(acState);
  Serial.print(" ");
  //Serial.print("  Fuel: ");
  Serial.print(fuelValue);
  Serial.print(" ");
  //Serial.print("  Heading: ");
  Serial.print(angle);
  Serial.println("");
This is mainly pushes the work over to the server, which is what we'll cover next...
The Server: Enter Python
The next stage in the flow is the server where the system takes the data from the Arduino, and makes it available to the internet. My inspiration for this bit of the project came from here: http://www.arcfn.com/2009/06/arduino-sheevaplug-cool-hardware.html. Originally I was going to use a Sheevaplug myself, but I bricked it while trying to update the OS on it to support FTDI, so I was forced to use a little Asus EEPC instead.
A Bit About Python
This was my first bit of Python programming that actually did something. I was still in that early stage where you take someone's code a build on top of it. So this is really Ken Shirriff's code where I've added a few cosmetic changes to. Python is a magical programming language. It's very high-level and is great for gluing bits of things together-- much like Perl, but you can't build an entire HTTP server in 3 lines of Perl.
In this example we're running multiple threads in the program, one accepts data from the USB port and stores them in files on the server, the other operates a simple HTTP server and provides access to these data. The best way to tear apart and understand this code is to start at the bottom and work your way up as more classes are added.
Entry and the Main loop
The bottom-most bit of code is what gets executed first when you run the program:
def main():
  ard = Arduino()
  ard.start()
  server = HTTPServer(('', 80), MyHandler)
  print 'Starting server'
  server.serve_forever()

if __name__ == '__main__':
  main()
That bottom bit instructs the program what to do if it's the main thread. Which tells us as the reader that this will be a mutli-threaded bit of code and it's a simple instruction: "if you're the main thread, call the main() routine." The main() routine instantiates the Arduino() class, creates a thread that executes that, and creates another thread to execute the HTTPServer.
Arduino Loop
Let's now look at the Arduino() class definition:
# Read data from Arduino serial port a line at a time
# and dump to file with timestamps
class Arduino(threading.Thread):
  def run(self):
    f = open('/tmp/data', 'a')
    latest = open('/tmp/latest', 'w')
    # Port may vary from /dev/ttyUSB1
    self.ser = serial.Serial('/dev/ttyUSB0', 115200, timeout=10)
    self.ser.flushInput()
    old_timestamp = None
    while 1:
      data = self.ser.readline().strip()
      if data:
	timestamp = time.strftime("%m/%d/%Y %H:%M", time.localtime())
	if timestamp != old_timestamp:
	  # Only log once per minute
          print >>f, timestamp, data.strip()
	  old_timestamp = timestamp
        print >>latest, timestamp, data.strip()
	f.flush()
        latest.flush()
ard.start() creates a thread and then starts exeucting at ard.run() which is the only routine defined in the Arduino() class. I wanted to maintain two data files while this executed: one that kept the running history of values, and a file that was a single line that kept the latest values. So I open the running-history file in append mode, and the latest data as a write (which will overwrite the old contents of the file.) Next we open up the USB port, /dev/ttyUSB0 on the Asus demo box. Now that this is all set-up, we enter an infinite loop with the "while 1:" construct. Herein we set the data variable to be the line of data coming in from the Arduino, and strip off the end-of-line character(s). If a line has been received from the USB/serial port it calculates the current time, renders it in a nice human-readable format that is accurate to the minute. If the event is recorded on a different minute it will write it to the running history. It will always write the latest condition to the current-data file. The flushes to f and latest, ensure that the files are updated/overwritten as they were defined.
This is the one thread created by the main loop, the other is the HTTP Server.
Simple HTTP Server in Python
I'm going to jump back up to the top of the code for a moment. Where we illustrate some of the magic of Python:
import os
import serial
import threading
import time

from BaseHTTPServer import HTTPServer
from SimpleHTTPServer import SimpleHTTPRequestHandler
Here we pull in the various libraries do all of the heavy-lifting that makes Python so powerful for these types of applications. This allows me to set up an HTTP server in a jiffy. It'll serve up the current directory that you execute the script from and make it viewable to a remote browser (which can be a security problem, so be careful about that,) but it also sets it up to call subroutines depending on the URL that the client passes to it. First, lets skim through the code that sets this all up:
# The web server. Supports /graph (page containing the graph)
# and static web pages
class MyHandler(SimpleHTTPRequestHandler):
def do_GET(self):
if self.path == '/fuel_graph':
return self.fuel_graph()
if self.path == '/status':
return self.status_table()
if self.path == '/raw':
return self.latest()
# Static file
return SimpleHTTPRequestHandler.do_GET(self)
# return raw data
def latest(self):
latest = os.popen('tail -1 /tmp/latest','r')
line = latest.readline()
self.send_response(200)
self.send_header('Content-type', 'text/plain')
self.end_headers()
self.wfile.write(line)
# Generate and display the graph
def graph(self):
g = os.popen('gnuplot', 'w')
print >>g, GNUPLOT_CMD
self.send_response(200)
self.send_header('Content-type', 'text/html')
self.end_headers()
self.wfile.write(GRAPH_HTML)
# Generate and display the fuel graph
def fuel_graph(self):
g = os.popen('gnuplot', 'w')
print >>g, FUEL_GNUPLOT_CMD
self.send_response(200)
self.send_header('Content-type', 'text/html')
self.end_headers()
self.wfile.write(FUEL_GRAPH_HTML)
# Status table generator
def status_table(self):
self.send_response(200)
self.send_header('Content-type', 'text/html')
self.end_headers()
self.wfile.write(STATUS_HEADER_HTML)
###latest = open('/tmp/latest','r')
latest = os.popen('tail -1 /tmp/latest','r')
line = latest.readline()
sample_data = line.split();
if (sample_data[2] == "1"):
self.wfile.write("Generator ON Generator OFF Air Conditioner ON Air Conditioner OFF Fuel (History) ")
fuel = int(sample_data[4]) * 0.09775171
if (fuel < 50):
self.wfile.write("")
else:
self.wfile.write(" ")
self.wfile.write(fuel)
self.wfile.write("% Camera Heading ")
self.wfile.write(sample_data[5])
self.wfile.write(" ")
self.wfile.write(" Timestamp ")
self.wfile.write(sample_data[0])
self.wfile.write(" ")
self.wfile.write(sample_data[1])
self.wfile.write(" The do_GET(self) is called when a user makes a GET request to the server. It checks if it matches one of the special directory names (fuel_graph, status, or raw) if it does it calls the appropriate subroutine to get the output, if not, it treats it as a normal request to the server.
These routines mostly return simple HTML code that is sent on to the client. The fuel_graph routine calls Gnuplot to create an on-demand graph of the fuel status. The resulting image file is placed in a known-location on the server and the routine returns HTML to call that image.
Putting the Server Code All Together
There's not much more than the main routine that creates two threads and the Arduino and HTTP Server thread. There's additional code there to help present HTML back to the user easily. Altogether the script is available here since all of the static HTML in it plays havoc the syntax highlighter on this site.
- Log in to post comments